New Crop

Thank you to all the new subscribers
Our goal is to give you actionable as well as educational information. We will always try to be concise and to the point.
As a member, you will always have access to our premium members-only content right here on our website. New content and market analysis will also be delivered directly to your email inbox as soon as it's released. You may see some parts of the members section posted on Barchart.com, or the homepage to draw more interest to the website and service.
It is very important to remember that the Fibonacci retracements are in a constant state of flux, just as the markets are and this is why we always say,
We will watch all the retracements on every move to see just how strong, or weak the market is regardless of the longer term target.
In this update I want to go over the New crop for Wheat, Corn and Soybeans and their relation to the Old crop. These levels are key to the long term trends in the November and December contracts. Everything else will be covered in the weekly update this weekend.
One of the things we will cover this weekend is the Wheat Hourly chart (above). There are so many examples of the ONE44 Fibonacci rules and Guidelines in action that you can get a greater understanding of how to use these rules in any market and any time scale you want to trade. All of these examples happened in a 2 week time frame!
Wheat
Despite the May wheat going to much higher prices, the December wheat is in a stronger position based on their past lows and current Fibonacci retracements. After the meteoric rise in the May contract it has already hit its long term swing point of 1041.00 and the rally from it has only been able to get back to 38.2% of the break. At the same time as the May hit 1041.00 the Dec. held 38.2% of the last leg up at 947.00, this was also 23.6% of the contract high and low. It did trade below, but never closed below it. The rally from there took it to 78.6%, when May could only go 38.2%. For now use 947.00 as the short term swing point, above it look for new highs and below it, look for the long term swing point at 870.00, this is 38.2% of the contract high and low and 61.8% back to the 1/14/22 low.

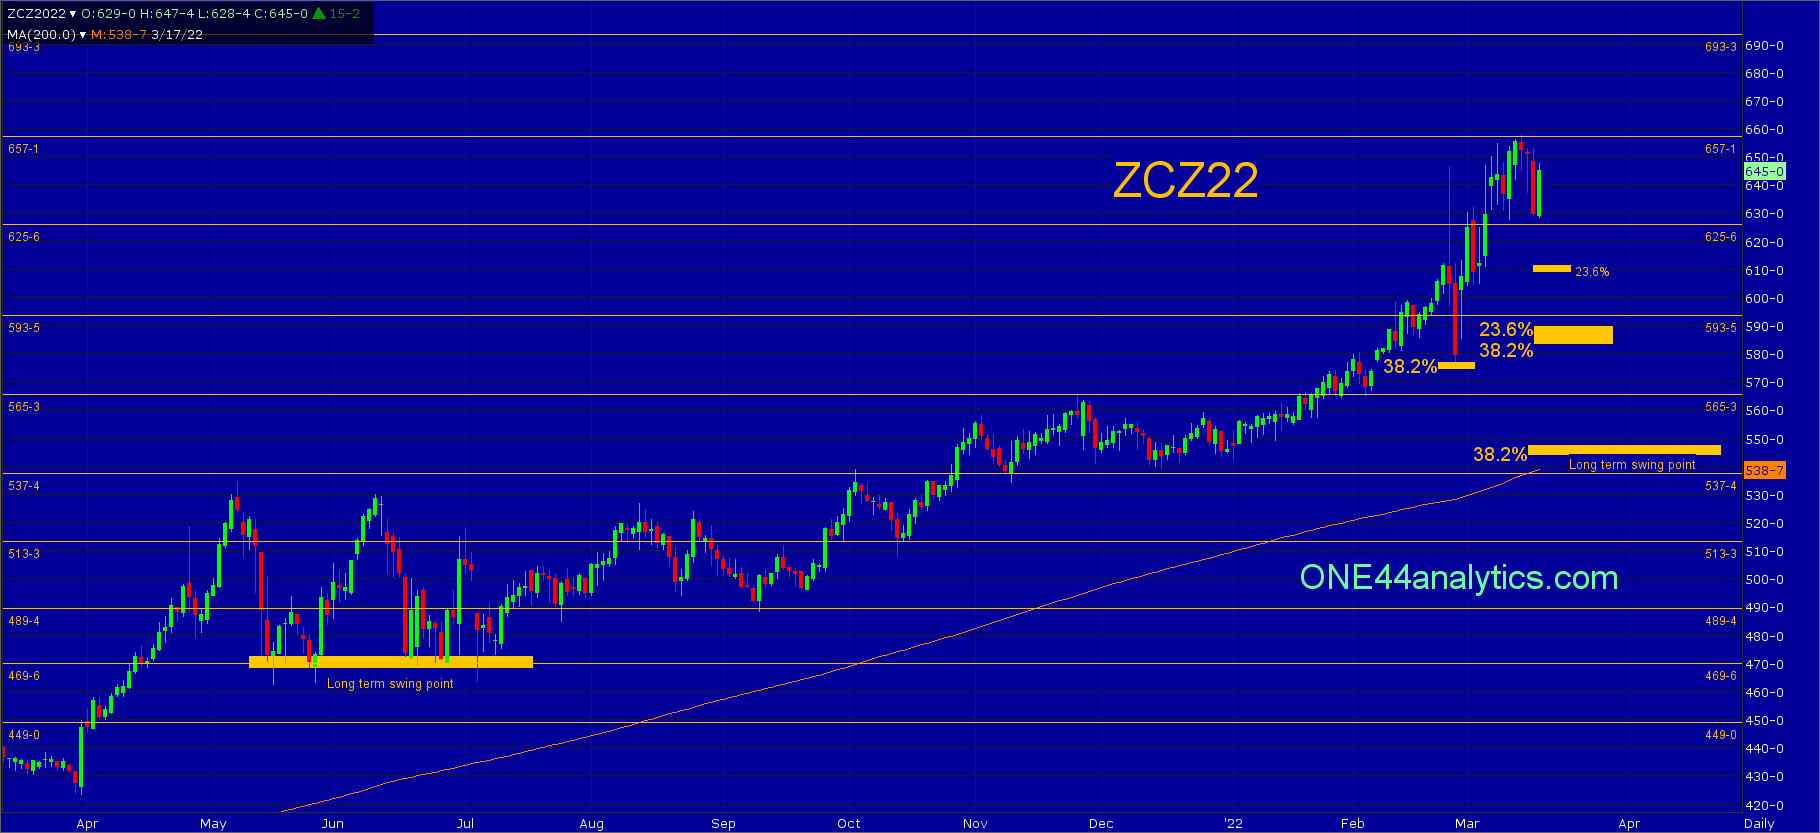
Corn
May and Dec. Corn remain extremely strong, on 2/25/22 they both hit 38.2% back to the long term swing point low in June of 2021. Key levels below are the area of 589.00 to 583.00, this is 23.6% back to the contract low ans 38.2% back to the June 2021 low. The long term swing point is 548.00, this is 38.2% of the contract high and low. Use the 625.75 major Gann square as the short term swing point, above it look for the next major Gann square of 693.25, since they have already reacted from the 657.00 major Gann square. Below it look for the area of 589.00 to 583.00. Any break that can only get to 23.6% of the June 2021 low at 611.00 keeps this market extremely strong.
Soybeans
The November is showing a little weakness in comparison to the May. The setback on 2/25/22 fell 28 cents short of the combination area of 1551.00 in the May and the November hit 38.2% (1403.00) of the 6/17/21 low. The May rally hit 78.6% and the November hit 61.8% (1497.00). On a setback from 61.8% look for the area of 1403.00 to 1389.00, the second level is 23.6% of the contract high and low. The long term swing point is 1280.00, this is 38.2% of the same move and also a major Gann square. For now use the 1464.00 major Gann square as the short term swing point, above it look for the next major Gann square at 1568.25 and below it 1403.00 to 1389.00.

FULL RISK DISCLOSURE: Futures trading contains substantial risk and is not for every investor. An investor could potentially lose all or more than the initial investment. Commission Rule 4.41(b)(1)(I) hypothetical or simulated performance results have certain inherent limitations. Unlike an actual performance record, simulated results do not represent actual trading. Also, since the trades have not actually been executed, the results may have under- or over-compensated for the impact, if any, of certain market factors, such as lack of liquidity. Simulated trading programs in general are also subject to the fact that they are designed with the benefit of hindsight. No representation is being made that any account will or is likely to achieve profits or losses similar to those shown. Past performance is not necessarily indicative of future results.